
I believe these 11 indicators can increase the appeal of video and increase conversion rate.
YouTube is the second largest search engine in the world after Google, so if video is part of your marketing strategy, you may have invested a lot of time, energy, and creativity on YouTube, even incorporating tools like an AI music generator to enhance your video’s audio and engagement.
So, for marketers and creators, understanding YouTube algorithms and tracking key metrics that improve video performance is a compulsory course on the marketing road.
This article will introduce you to 11 key metrics worth tracking in the YouTube Algorithms Control Panel and analyze these key metrics to optimize your YouTube channel.
1. Fully understand the viewing time
Undeniably, the number of views should be an important indicator of the success of a YouTube video. But simply analyzing the number of views does not provide more information to improve the quality of YouTube videos. Because the prevailing trend of the title party scams clicks, resulting in a high number of views. So instead of giving too many weights to the views, YouTube removes the “views” completely from the side menu of the control panel and replaces it with “watch time.” As shown below, YouTube puts “watch time” in the Top priority: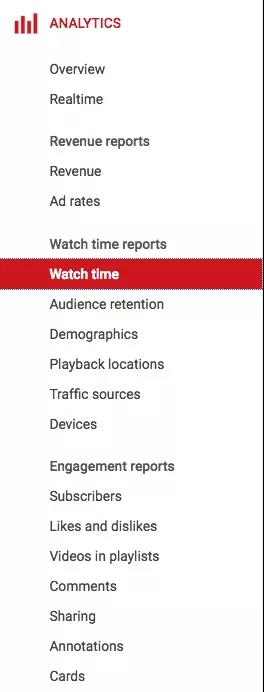
What is the length of the watch?
YouTube defines the length of time as the total number of minutes to watch a video. Matt Gielen, former vice president of Frederator Networks, mentioned in the tubefilter about WTH Is Watch Time, watch time = views * average watch time.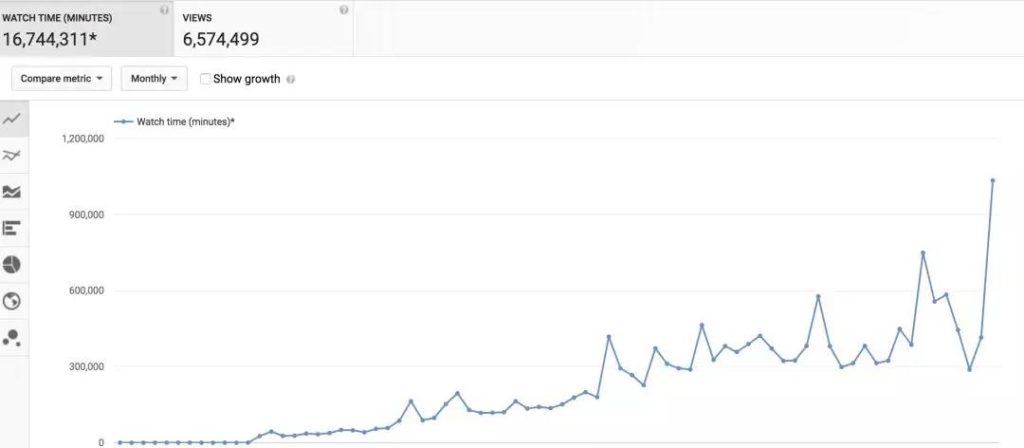
The average watch time, which is the length of time people watch the video on average, is critical in the length of the watch. Eric Meyerson, YouTube’s chief creative marketing officer, said, “…the average family has to watch TV for hours every day. YouTube has a lot of room to grow as the most important viewing medium in more family life.” .
Obviously, in order to go beyond the TV media and let users spend more time watching the videos they are interested in, YouTube has optimized all the algorithms for promoting videos (such as search pages, recommended videos, etc.), which explains why the average viewing time is the dimension. Particularly important.
In summary, if YouTube creators want to improve their video performance, they must optimize the viewing priority of Top priority, which is the two key metrics that need to optimize the viewing time: view count and average watch time. For YouTube creators and marketers, it’s important to keep in mind that content is king, and high-quality video that attracts users to watch and watch is the foundation for improving performance.
2. Pay close attention to real-time reports
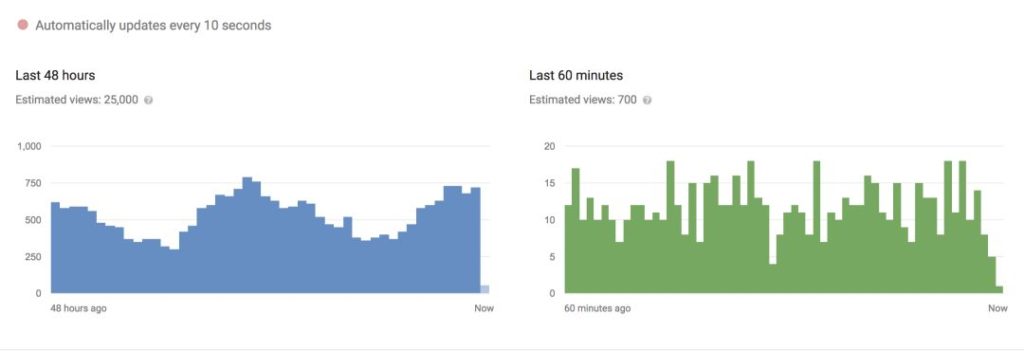
When YouTube counts views, it removes unwanted views and low-quality views from the total number of views. At the beginning of the video release, you need to keep a close eye on the channel’s real-time reports and see the estimated views of the channel or a particular video over the past 48 hours (nearly two days) and the past 60 minutes (nearly an hour). In this way, to understand and analyze video marketing effects, promotion channels, and so on. If someone shares your video on Reddit or other social networks, the data in the YouTube Algorithm Control Panel will show a significant upward trend.
When your video is still hotly debated by users, take the opportunity to search for the YouTube video ID in time, see where your videos have been shared, and take the opportunity to post posters, posts, etc. for your video. Attract more users.
So for marketers, how do you track the real-time reports of the collaborative YouTube network red? If you can’t enter YouTube’s red control panel, what if NetEase is not willing to share first-hand data? You can consider using tracking tools (such as NoxInfluencer ) that help us monitor video delivery in a timely manner.
3. Determine the source of the traffic
When analyzing video audiences, it’s also important to pinpoint the source of your fans.
In the traffic source of the YouTube Algorithms Control Panel, there is a chart showing the various traffic source channels as shown below to see how users find your videos.
The YouTube Algorithm Control Panel determines the optimal traffic source for your entire channel and each video you create. Don’t just stare at the number of video views they bring. Be aware that the quality of the traffic from different channels is different.
If your video brings high quality traffic through some keyword searches on YouTube, you can further optimize your video keywords. This way, users can find your videos when they search for relevant keywords on YouTube to attract high-quality views. If you get a huge amount of traffic from a certain channel, you can increase the investment in this channel, or you can find similar channels to promote the results.
4. Determine your demographics
The YouTube Demographics report lets you know the YouTube audience age, gender, and audience location, and can directly judge whether it matches your goals.

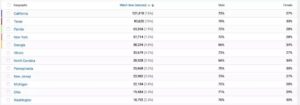
On the “Audience Analysis” page, just click on the “More” option on this page and go to “Location”, you can see the number of fans from all countries, as shown below:
YouTube audience analytics to more accurately target targeted advertising to potential target audiences. Therefore, when marketers are looking for network red cooperation, try to obtain the file data of each network red and analyze the demographic characteristics. If you can’t get it, you can also view the demographics of the red page by using a third-party YouTube analytics tool.
5. Focus on the playback position
If you know where the video is being played, you can see how fans found your video.
Through the YouTube Algorithm Control Panel you can find the total number of times played on the playback location page and each video playback location, where the playback location is the YouTube channel page, the YouTube watch page, the embedded external website, or the app.
From this data you can see where the video is most popular in order to optimize YouTube video channels based on actual conditions.
6. Analyze fan viscosity
In the Fan Viscosity page of the YouTube Data Analysis panel, you can see when the fans stopped watching the video. With this information, you can easily find out when the video lost fans and what it is. The reason for them to leave, this information can help you avoid similar errors when creating videos later.
As shown in the above image, the average viewing time is 1 minute and 13 seconds, which is about 84% of the total video. You may think that the data is very good, but according to YouTube standards, this video can only be called a short video. In longer videos, you can still see a more obvious downward trend in the data.
There are two pieces of data in the figure above, you can view it by switching tabs:
● Absolute Fan Visibility: By looking at the percentage of total time spent on each page, you can find which part of your favorite video. Through this data, you can understand the specific behavior of fans, such as skipping the introduction and so on.
● Relative Fan Visibility: With this data, you can compare your video to other YouTube videos of similar length to see if your video is below or above average.
At the same time, you can also look for the key time points of the sharp decline in ratings, analyze what is the content of this time node and cause fans to have a negative reaction, so as to take targeted measures to prevent the loss of fans.
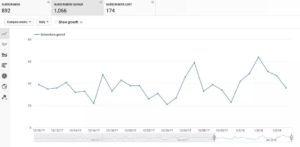
7. Track subscription rate
YouTube subscribers are most likely your potential customers or existing customers who are interested in your product or market positioning.
Therefore, it is also important to monitor the fluctuations in the subscription base. By monitoring this volatility, you can observe your YouTube channel from a macro perspective and understand the impact of each video on the get-down subscription.
Through the YouTube Algorithms Subscriber panel, you can see how many subscribers are getting or losing each video.
The more subscribers you have, the better your chances of product exposure through the YouTube subscription stream.
In the video, join a YouTube Card to recommend a list of channels or a specific premium video, allowing fans to watch more channel highlights and get more subscribers.
How to add a YouTube Card, note: After entering the control panel, be sure to choose the Creator Studio Classic (the version of the YouTube Control Panel is divided into beta and classic), otherwise you won’t be able to see these features.
We can also judge content performance by view volume and subscriber metrics: the percentage of video views/subscribers’ net increase, and the smaller the percentage, the better the effect of attracting subscribers. If a video can increase user subscriptions, consider investing more time or money and focusing on promoting the video.
8. Social sharing analysis
For YouTube communication, social media is indispensable. Through social media, we can also analyze and understand who is sharing videos and how they are shared.
Click on the sharing page of the YouTube Algorithms Control Panel and we can see sharing from different platforms, such as social networks and social tools.
From the above report, it can be concluded that this sample video is mainly shared by a private information application, and this cannot be traced.
Incorporating video content into social media strategies, especially where users have begun to share your videos, can increase the effectiveness of sharing.
9. Comment monitoring
Reviews are one of the most important ways to measure fan engagement. We can focus on who is commenting and what they comment on to turn fans into customers.
You can see the frequency and date of the comments by clicking on the comments page of the data analysis under the YouTube Control Panel. You can also see the total number of comments for each video. Go to the comments section and look for opportunities to interact with your fans and get high quality feedback.
For YouTube creators, be sure to try to interact with fan feedback to highlight the quality of their products and guide fans to their brand or watch other videos.
In addition, you can pin one of your comments and direct fans to the relevant URL (which can greatly increase click conversion rate for marketers).
10. Likes and points
Likes and clicks are the most intuitive feedback from fans on your video. If the video has a lot of hits, then you need to analyze and solve several questions: whether the video content matches the title, whether the target audience is accurate, video quality and video upload. Does the frequency disappoint fans?
In addition, you can find the reasons for the disproportionate number of steps in some comments, so you can quickly identify problems and improve them.
11. Impressions
If the video impressions are high, but the number of views is small, you may need to improve the video cover thumbnails and video titles to make them more appealing to potential fans.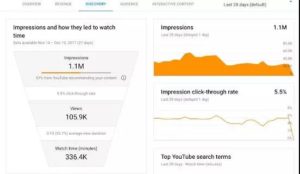
YouTube Algorithm Add-on
The built-in YouTube Algorithm Control Panel is not the only data source available, and many third-party websites and tools help us better monitor and optimize YouTube.
● VidIQ : is a Chrome plugin that provides in-depth analysis of YouTube videos on a watch page to help optimize your videos.
● Google Trends: Use Google Trends to analyze search volume trends, discover current hot topics, and use this to create video content that matches trends. Added YouTube filtering to help analyze YouTube search trends.
These are the 11 key metrics of the YouTube algorithm. I hope that you can optimize the video based on these key metrics, which will ultimately increase the appeal of the video and increase the conversion rate.