
Are you a user of location-based services like food delivery apps, Swiggy, Zomato or taxi services, Uber or Ola? If yes, you eager to know how these location-based companies optimize their routes, manage transportation services or deliver products efficiently.
We will get you to know Geospatial analysis and mapping visualization is the reason behind these things to happen. Geospatial analytics helps multiple industries in providing better customer services. Location-based services need to make better decisions and better understand Geospatial analysis. Here we will show you some ways to perform geospatial analysis and mapping visualization in tableau.
What do you mean by Geospatial analysis?
For managing things efficiently, most industries are storing data in the form of spreadsheets. But it can be a challenging way to handle things and produce insights.
Suppose you are running a business through which you are selling your products and services.
And you want to locate in which place your prominent customers situated or in which region the demand for your product is higher.
However, relating to location-based decision-making, there must be countless scenarios.
Many companies create sheets with columns like Country, state, postal codes, quantity, discounts, profits and sales. But the question is how to produce insights through this information in spreadsheets.
Here Geospatial analysis and mapping visualization come into action. It helps to collect, store, analyze and generate insight through information in spreadsheets.
It becomes easy to recognize patterns hidden inside spreadsheets through Geospatial analysis. Below we will show you how to conduct Geospatial analysis and mapping visualization in tableau.
Steps for creating your visualization
Here we are using the US superstore dataset to create the visualization. You need to understand the location-based dimensions after opening the data set.
However, you will see Country, city, state and postal codes in the dimensions pane. Let us see the steps for Geospatial analysis and mapping visualization in tableau.
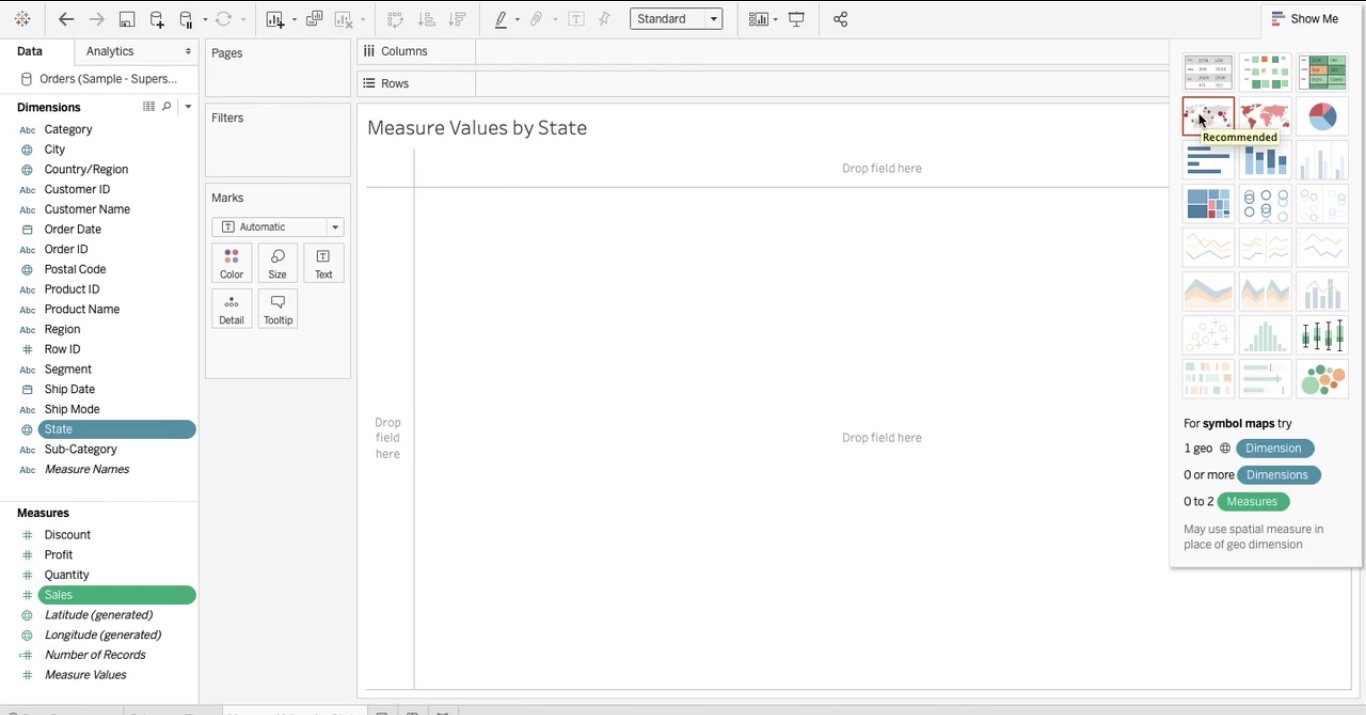
Step1:- Press ctrl+ to select state and sales. In the upper right corner, click on the show me button and select the recommended map.
A regular world map will appear on your screen. But there is an issue. You will see multiple locations with the same name. So that is why you need to tell what you want.
There are some unknown messages on the bottom right corner of your screen. You need to click on these messages, and a popup window will appear.
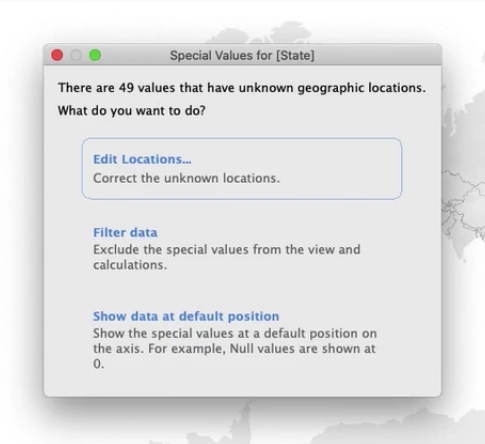 Step2:- Click Edit location on the popup window. And choose your country and region. Select the form field. However, your place will automatically appear on the box.
If you live in the United States of America, US will appear. Click on the ok button and the map visualization will appear in tableau.
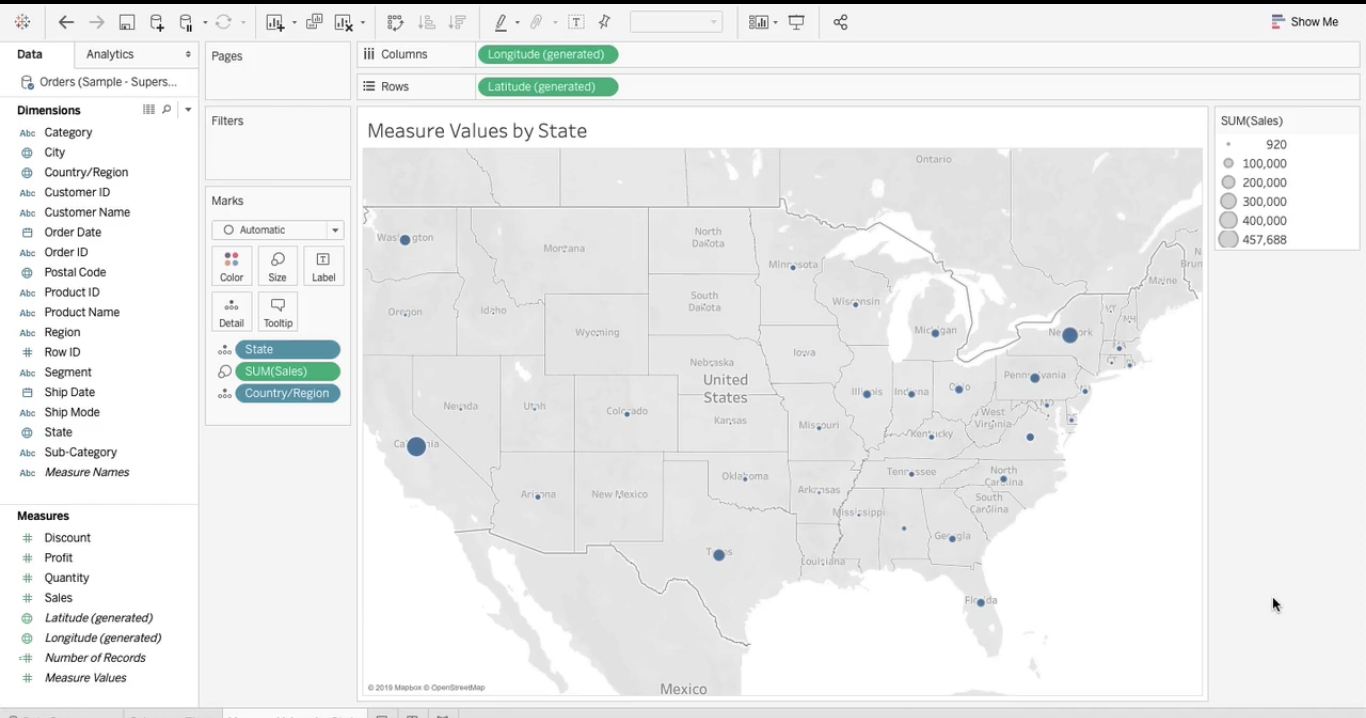
Step3:- Below mark cards, click on the dropdown. Select map. The size of the map does not change. You have to put some colors and measures on the map to solve this problem.
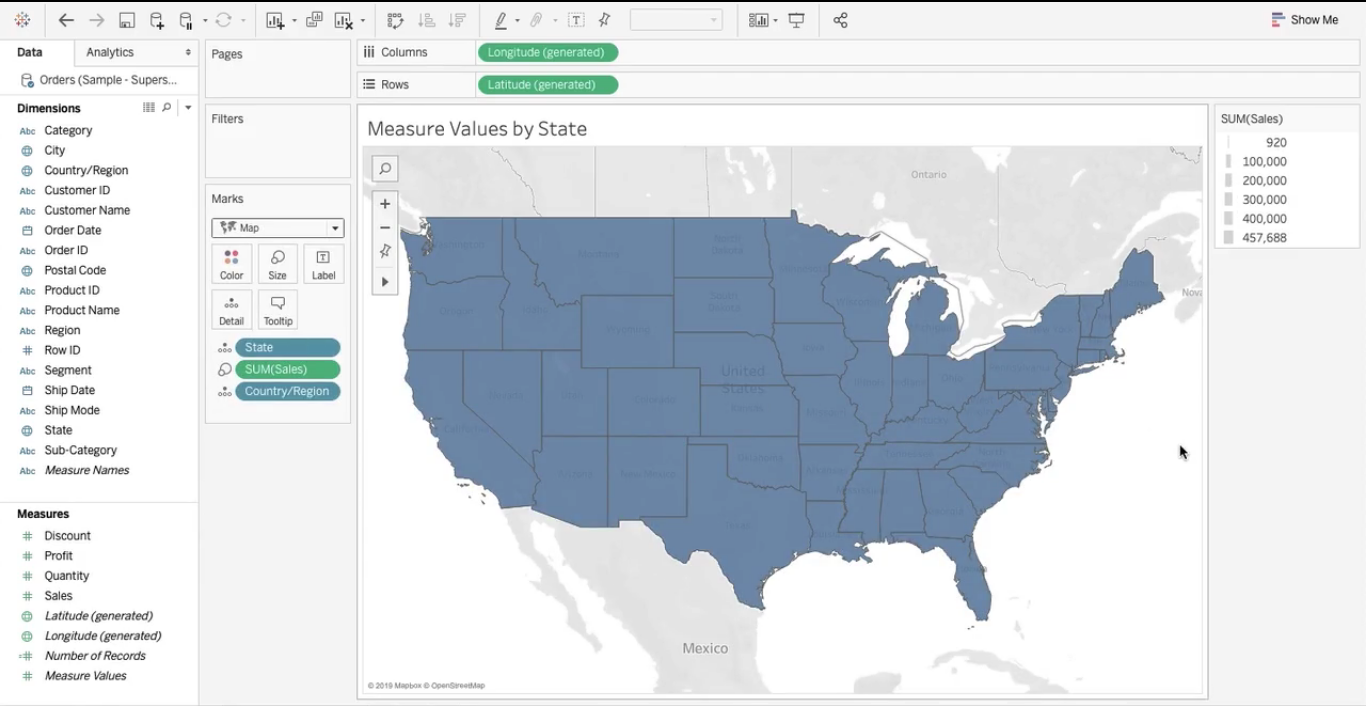
It will show the distribution of colors and measures on the map.
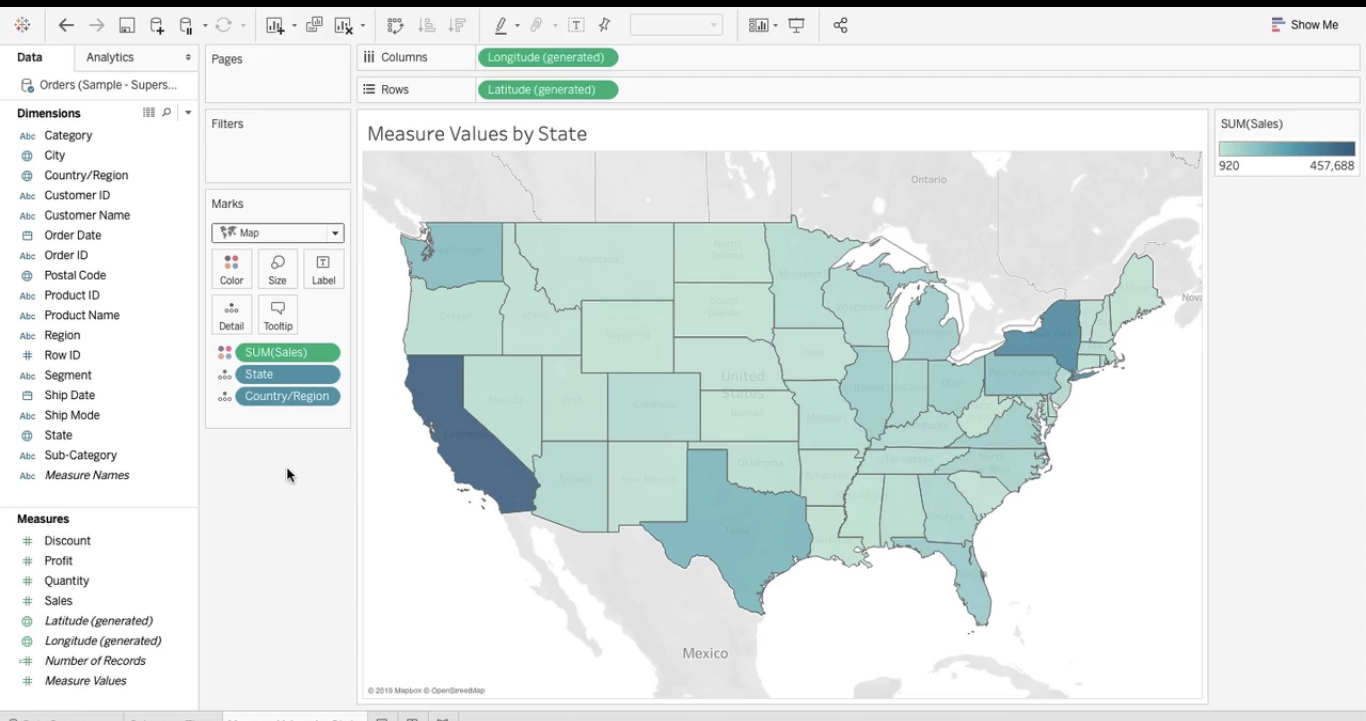
Now, you can see which state has the higher sale and which state has less.
Some applications of Geospatial analytics
Here we will show you some applications of Geospatial analysis and mapping visualization.
1.Logistics and transportation
Geospatial data will help in location-based planning of transportation and logistics. However, it can result in maximizing efficiency, cost-cutting and supplying chain management.
2.Sales and Marketing
GIS analysis helps to understand customer needs by targeting the sales and marketing team.
3.Situational Intelligence
Map-based visualization helps many businesses to understand any situation more efficiently.
4.Satellite imagery
The map on your smartphone will help you to reach any place more efficiently.
5.Strategic growth
Many industries are using Geospatial analysis for understanding areas to expand their operations.
Wrapping up
In this article, we showed you how to perform Geospatial analysis in tableau and some applications of Geospatial analytics. However, in this tech-savvy world, Geospatial analysis has become a vital part of our life. We can use GPS to track people and places.